AEDS contains official ASEAN statistic data and related energy news and policies to help you understand the energy landscape of ASEAN and each of its Member States. Explore more by clicking each icons provided below to start your search.
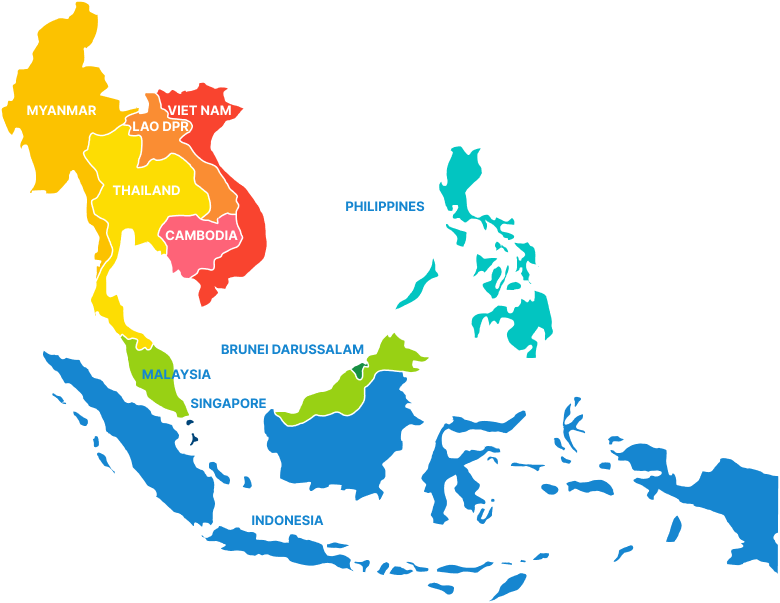
Access AEDS by Country
We also tailored AEDS in a way that you could access statistic and related information by country. Understand better each country energy profile by clicking icons below.
Sankey Diagram provide an overview of the main energy flows and how they contribute to the global energy balance of a certain territory. It features directed arrows in which the width of these arrows are proportional to the flow quantity. Within a Sankey Diagram, the directed flow is always drawn between at least two nodes (processes). Thus it shows not only flow values but also information about the structure and distribution of the energy balance.
Racing Bar Chart
Racing bar chart helps to visualize the changes in trend over time. This type of chart is very popular as it provides a holistic data story/insight in a concise and easy to understand chart. This chart represents the display of energy supply, energy consumption, and share of renewable energy by country and by fuel.