Menu
Under the ASEAN Plans of Action for Energy Cooperation (APAEC), 2016-2025 with the theme “Enhancing Energy Connectivity and Market Integration in ASEAN to Achieve Energy Security, Accessibility, Affordability and Sustainability for All”, the ASEAN Economic Community (AEC) calls for a well-connected ASEAN to drive an integrated, competitive and resilient region. Energy infrastructure is one of the main factors for energy development in the region because of its direct impact on energy connectivity and energy market integration.
Based on its definition, energy infrastructure comprises many components such as the physical network of pipes for oil and natural gas, electricity transmission lines, other tools to transport energy to consumers, including facilities that turn raw natural resources into useful energy products such as the rail network, truck lines, and marine transportation. Under the APAEC 2016-2025, the energy infrastructure in ASEAN covers two main energy transport components; a gas infrastructure called the Trans-ASEAN Gas Pipeline (TAGP), and a power infrastructure called the ASEAN Power Grid (APG). This article shows the current status of energy infrastructure in ASEAN’s power sector.
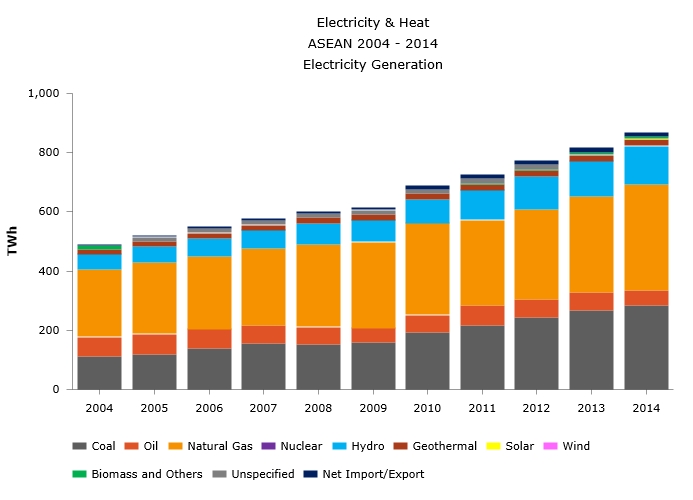
The main energy infrastructure in ASEAN’s power sector is the power plant. In 2014, 76% of total power capacity in ASEAN was generated by fossil fuels, of which oil-based, coal-based and natural gas-based power plant reached 15.75 GW, 54.73 GW and 73.52 GW, respectively. To mitigate climate change issues, ASEAN Member States (AMS) nowadays prefer to build lower emission fossil fuel-based plants (e.g natural gas and coal), than high emission fossil fuel-based plant (oil). As shown in the 2004-2014 data, there was a decline in the percentage of oil-based power plants, from 15% in 2004 to only 8% in 2014, while the percentage of the coal and renewables-based plants increased from 19% to 29% and 17% to 24%, respectively (see Figure 1). Among all AMS, the largest contributor to coal power in 2014 was Indonesia, Malaysia and Vietnam, while Indonesia, Malaysia and Thailand were the largest contributors of natural gas.

By 2015, the total installed capacity of ASEAN rose to 206,818.45 MW from only 90,598 MW in 2004, or equal to the annual growth rate of 7.75% for the last eleven years. Indonesia, Malaysia, the Philippines, Thailand and Vietnam are the top five Member States which contribute to 87% of total power capacity in ASEAN. Singapore and the rest of AMS only contributed 6% and 7%, respectively. With that amount of capacity, the recorded total power generated in ASEAN by 2015 is 915,579 GWh or increased from 856,279 GWh in 2014.
The other energy infrastructures for the power sector are transmission and distribution system. In 2015, the recorded total transmission lines in ASEAN was 230,987 km, when the substation reached 425,222 MVA. Each Member State has its own losses in its transmission and distribution (T&D) line. The highest T&D losses are recorded in Myanmar, reaching 19%, followed by Brunei Darussalam at 14%, while the lowest loss is experienced by Thailand at 1.61%.
In the long term, all AMS is expected to develop and enhance their energy infrastructures. One of the activities laid out in APAEC 2016-2025 is to continue the implementation of cross-border interconnection and the development of the first multilateral connection, namely the Lao PDR-Thailand-Malaysia (the LTM Project) grid connection. The activity’s main objective is to support the outcome of ASEAN Power Grid (APG) under the APAEC 2016-2025; to initiate multilateral electricity trade in at least one sub-region by 2018. Furthermore, investment is also an important element in reaching the APAEC targets which will require USD 27 billion of annual investment in ASEAN (1% of the region’s GDP) or USD 290 billion in total by 2025, with 75% of it allocated exclusively for the power sector. In conclusion, ASEAN is one of the most prospective regions for energy infrastructure investments and for power market development.
| Country | Electrification Rates (%) | Installed Capacity (MW) | Electricity Generation (GWh) | Transmission Length (km) | Substation Capacity (MVA) | T&D Losses (%) |
| Brunei Darussalam | 100% | 805.00 | 3,775.72 | 720.65 | 1,662.00 | 14.00 |
| Cambodia | 66% | 1,899.00 | 5,698.00 | 1,405.00 | 3,052.00 | 4.27 |
| Indonesia | 88% | 52,889.22 | 233,982.00 | 41,863.00 | 92,651.00 | 9.77 |
| Lao PDR | 88% | 6,290.00 | 33,590.00 | 4,393.00 | 1,540.00 | 7.12 |
| Malaysia | 100% | 30,875.23 | 143,826.00 | N/A | N/A | 1.63 |
| Myanmar | 32% | 4,805.00 | 14,156.00 | 61,569.60 | 22,525.00 | 19.00 |
| Philippines | 90% | 18,765.00 | 82,413.00 | 20,073.00 | 31,038.00 | 3.69 |
| Singapore | 100% | 13,009.00 | 50,272.00 | 27,400.00 | N/A | 3.00 |
| Thailand | 100% | 38,839.00 | 183,466.84 | 32,993.68 | 94,361.44 | 1.61 |
| Vietnam | 99% | 38,642.00 | 164,400.00 | 40,569.00 | 178,393.00 | 8.30 |
| ASEAN | 78.70% | 206,818.45 | 915,579.56 | 230,986.93 | 425,222.44 | 7.24 |
Table 1. ASEAN Energy Infrastructure in Power Sector. Source: HAPUA Directory 2016 and ASEAN Centre for Energy data.
Note: emission factor in one life cycle of power plant: 510-1170 gCo2 eq/kWh for oil, 290-930 gCo2 eq/kWh and 710-950 gCo2 eq/kWh for natural gas and coal.
Photo Credit: Matthew Henry
