Menu
The ASEAN Member States (AMS) is seeing an enormous move toward renewable energy sources, with member countries significantly increasing their usage of solar, wind, geothermal, hydro, and bioenergy. The Renewable Energy (RE) share in installed capacity for ASEAN reached 33.6% in 2022 and has set a target of achieving 35% RE in installed capacity by 2025 to increase significantly 39.6% under the AMS Targets Scenario (ATS) and 41.3% under the Regional Aspiration Scenario (RAS) driven by resilient government policies and efforts targeted at encouraging sustainability.

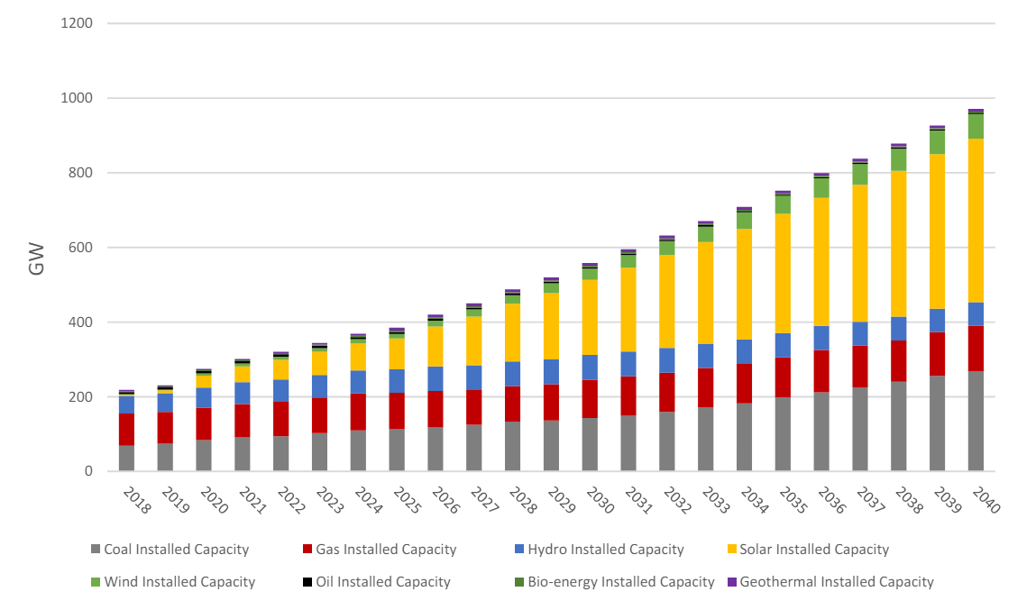
Figure 1. Project of Capacity Expansion (GW) under the High RE Target Scenario – ASEAN Region (2018 – 2040) [2]
In 2022, Viet Nam led ASEAN with 26,775 MW of total installed renewable energy capacity, dominated by 22,492 MW hydro and 3,897 MW solar. Thailand follows with 13,076 MW, mainly from 8,580 MW hydro, 2,692 MW wind, and 1,504 MW solar. Indonesia ranks third with 12,574 MW, dominated by 6,689 MW of hydro, 2,360 MW of geothermal and contributions of 272 MW from solar [3]. Under the High RE Target Scenario (Figure 1), ASEAN’s renewable energy capacity is projected to grow significantly, with combined capacities from hydro, solar, wind, bioenergy, and geothermal expected to increase from 58 GW in 2018 to 578 GW by 2040, reflecting a strong regional shift towards sustainable energy solutions [2].
The integration of Renewable Energy Resources (RES) into transmission lines has resulted in an increased use of Inverter-Based Generations (IBGs), particularly for solar and wind power. This change has resulted in harder power system stability since IBGs differ greatly from synchronous generators. Unlike synchronous generators, IBGs have no rotating mass, making them less efficient in maintaining system stability during short circuits or failures. The absence of inertia in IBGs leads to a higher Rate of Change of Frequency (RoCoF), which affects the frequency recovery mechanisms and huge power swings. These swings leading to system outages due to equipment tripping caused by frequency instability to some extent. Their low fault ride-through capabilities (1-1.2 p.u.) might cause delays in fault detection and response, especially for inverted overcurrent protection [4]. Conventional generators, in contrast, can provide much higher fault currents (5-10 p.u.) [4], aiding in faster fault detection and clearing. The lack of inertia also impacts frequency stability, contributing to increased harmonic distortion and voltage fluctuations. Moreover, the switching operations within inverters may introduce harmonic disturbances in the power output, distorting voltage and current, which may result in overheating of motors and transformers, as well as misoperation of protection devices. These difficulties provide substantial challenges to sustaining grid stability and power quality in systems that increasingly rely on IBGs.
The basic conventional control network often relies on Supervisory Control and Data Acquisition (SCADA) technologies. SCADA is a grid technology used for monitoring and controlling based on steady-state power flow analysis [5]. It consists of Remote Terminal Units (RTUs) that provide data to centralised servers. However, SCADA faces some limitations in examining the power system’s dynamic characteristics, namely the phasor measurement. The major consequences of being unable to see dynamic characteristics include incorrect monitoring, poor system stability, and ineffective problem identification and reaction, and increased harmonic distortion.
| Attribute | SCADA | PMU |
| Resolution | 1 sample every 2-4 second | 10-60 sample every second |
| Observability | Steady state | Dynamic |
| Measurement | ||
| Synchronisation | No | Yes |
| Phase angle | No | Yes |
| Focus | Local area monitoring and control | Wide area monitoring and control |
Table 1. Comparison between SCADA and PMU [5]
One of the main disadvantages SCADA compared to synchrophasor technology is they have limited sample frequency and phase angle measurement capabilities. SCADA can calculate Total Harmonic Distortion in Voltage (THDv) and Current (THDi), but it lacks the precision and speed needed to correctly capture the grid’s dynamic behavior. To solve these difficulties, technologies capable of sensing and interpreting dynamic behavior, such as phasor measurement units (PMUs), are required to improve system dependability and stability. PMUs provide real-time monitoring of the grid’s dynamic properties, resulting in a more precise and complete picture of system operation.
PMUs are power system monitoring devices placed within the busbars of a control area, which measure the voltage magnitude, angle, real, and reactive current [6]. The key difference between PMU and SCADA is that it uses synchrophasors, which, due to their high sampling rate, provide more accurate and real-time measurement data for precise and timely power system monitoring. Synchrophasors are time-synchronised electrical measures that detect the amplitude and phase angle of sinusoidal electrical waves. The term “synchro” refers to the time component of the measurement, whereas “phasor” refers to the form of the sinusoidal signal, including its amplitude, phase angle, and RMS magnitude of the current or voltage sine wave [5].

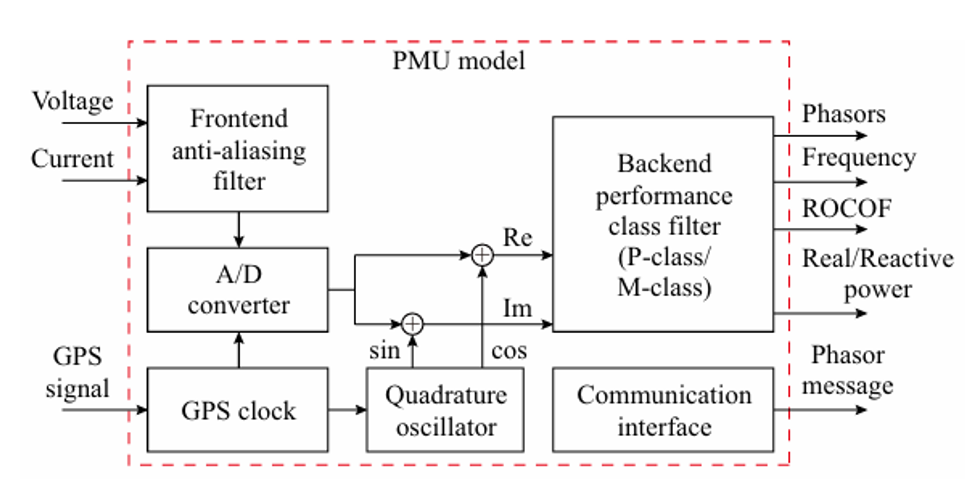
Figure 2. Functional Block Diagram of PMU model [5]
PMUs are electrical devices that perform synchronised measurements of AC voltage and current waveforms. It has powerful digital signal processors and employs a fixed sampling rate and GPS clock synchronisation to get real-time data. Signals are first filtered to reduce interference before being digitised and complex multiplication is used to calculate the phasor’s real and imaginary components. These components are further filtered to maintain accuracy in dynamic conditions, giving critical data such as synchrophasors, phase angle differences, frequency, Rate of Change of Frequency (ROCOF), and power metrics (real and reactive power) [5].

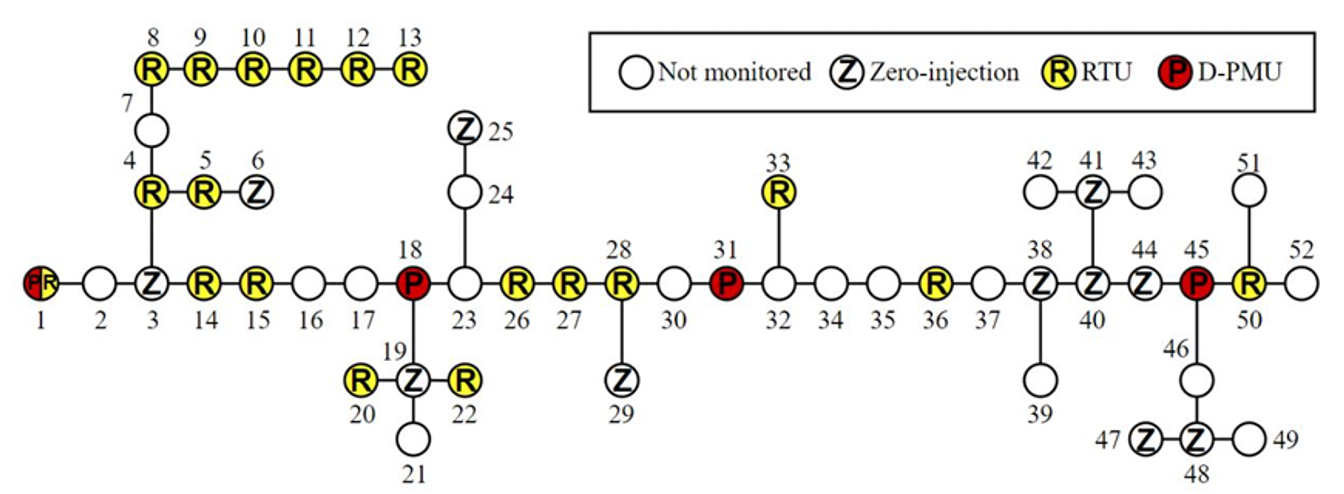
Figure 3. Single Line Diagram of Netze BW’s MV Feeder Selected for Study [7]
Synchrophasor technology plays a vital role in today’s power systems, as emphasised by Elia Grid International (EGI), a leader in grid technology. Recent research on a medium-voltage (MV) feeder, managed by the German distribution system operator Netze BW, has shed light on the practical challenges and benefits of implementing this technology (Figure 3) [7]. This Power Distribution Network Diagram, functioning as a “research laboratory,” is equipped with various distributed energy resources (DERs) with different load profiles, making it an ideal environment for advanced grid management research.
Figure 3 illustrates a detailed map of an electrical power system, highlighting monitoring points across the network, each uniquely identified by bus numbers 1 through 52. the numbers 1 through 52 inside or next to each circle represent unique bus or node identifiers, crucial for tracking and controlling different segments of the grid. Each circle represents a monitoring point in the network where electricity measurements are taken. The circles labelled with an “R” contain devices known as Remote Terminal Units (RTUs). RTUs are part of the Supervisory Control and Data Acquisition (SCADA) system, collecting data about the electrical current and sending it back to a central control system for monitoring and control purposes. Circles with a “P” contain Phasor Measurement Units (PMUs), advanced tools that provide detailed and accurate electrical measurements critical for high-speed grid management. The “Z” circles represent zero-injection points, where no electricity is entering or exiting, useful for system analysis. The blank circles indicate parts of the network that are not being monitored, potentially highlighting gaps in the system’s oversight [7].

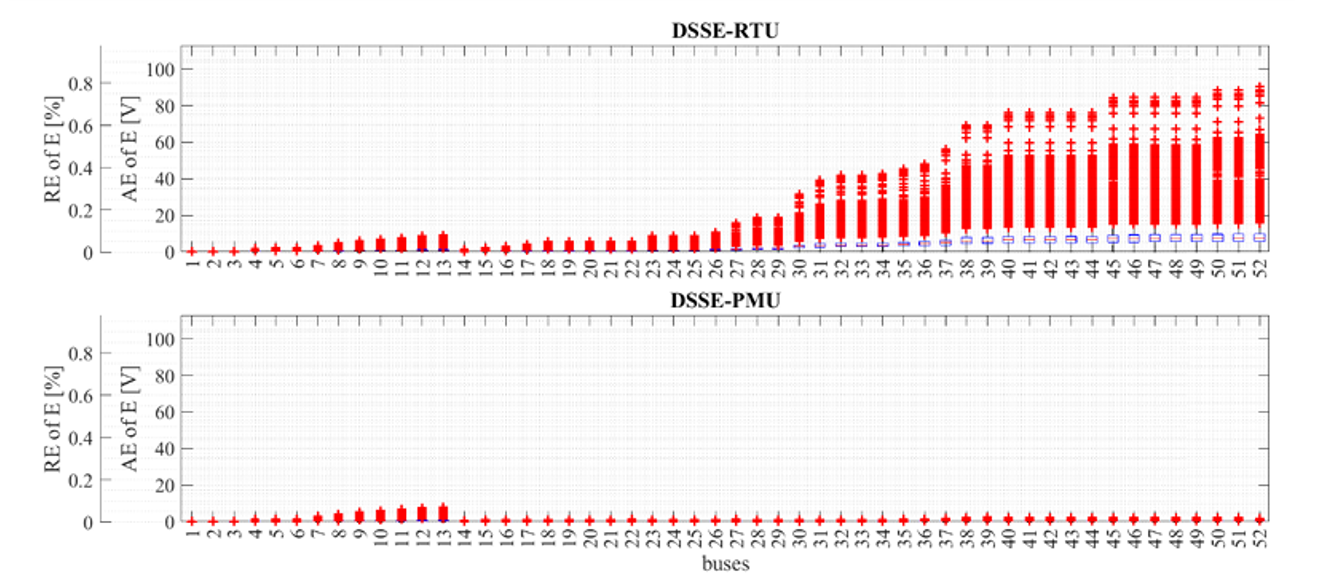
Figure 4. Boxplots of absolute error (AE) [V] and relative error (RE) [%] of voltages estimated by DSSE-RTU and DSSE-PMU [7]
Figure 4 provides a detailed comparison between Remote Terminal Units (RTUs) and Phasor Measurement Units (PMUs) in the context of Distribution System State Estimation (DSSE), using boxplots to illustrate the relative and absolute errors in voltage estimation across 52 bus locations within the network. The x-axis represents these bus numbers, while the y-axis quantifies two types of errors: the left y-axis shows the Relative Error (RE) of E [%] depicted by red bars, and the right y-axis indicates the Absolute Error (AE) in volts (V), shown by a blue line. The top boxplot for DSSE-RTU reveals that both relative and absolute errors increase significantly, particularly after bus 22, indicating decreasing accuracy in RTU-based voltage estimations as the bus numbers rise. In contrast, the bottom boxplot for DSSE-PMU demonstrates consistently low errors across all buses, with minimal deviation from actual voltage values, underscoring the superior accuracy and reliability of PMUs. Overall, this comparison clearly illustrates that PMUs significantly outperform RTUs, maintaining maximum relative errors below 0.1% compared to up to 0.8% for RTUs, making PMUs essential for real-time monitoring and precise grid management in modern power distribution systems [7].
Reverse power flow is a significant issue in grids with high DG penetration, leading to voltage instability and increased fault currents, complicating grid operations and protection schemes. Phasor Measurement Units (PMUs), or synchrophasors, provide a solution by offering precise phasor angle measurements, which are crucial for detecting and managing reverse power flows. The inclusion of PMUs enhances system event analysis and disturbance detection, improving the reliability and stability of the grid.
In conclusion, the adoption of hybrid approach combining synchrophasor and SCADA technologies presents a strategic course towards greater renewable energy integration in ASEAN region. Synchrophasor has shown its essential capabilities for managing the variability inherent and offers real-time insights, thereby fortifying grid reliability in a long-term operational cost. By investing in these advanced technologies while harnessing the strengths of existing SCADA systems and embrace innovative solutions in addressing economic realities, ASEAN nations can forge ahead with a resilient energy that supports sustainable development for a stable and greener future.
References:
[1] ASEAN Centre for Energy (ACE), “Thirty-First Renewable Energy Sub-Sector Network (31st RE SSN) Annual Meeting,” 2024.
[2] ASEAN Centre for Energy (ACE) and Heads of ASEAN Power Utilities / Authorities (HAPUA), “ASEAN Interconnection Masterplan Study (AIMS) III Report Phase 1: Capacity Expansion Planning Phase 2: Grid Performance Analysis,” 2024. Accessed: Jul. 02, 2024. [Online]. Available: https://aseanenergy.org/publications/asean-interconnection-masterplan-study-aims-iii-report/
[3] ASEAN Centre for Energy (ACE), “ASEAN Power Updates 2023,” 2023.
[4] Z. Chu and F. Teng, “Short Circuit Current Constrained UC in High IBG-Penetrated Power Systems,” IEEE Transactions on Power Systems, vol. 36, no. 4, pp. 3776–3785, Jul. 2021, doi: 10.1109/TPWRS.2021.3053074.
[5] M. U. Usman and M. O. Faruque, “Applications of synchrophasor technologies in power systems,” Mar. 01, 2019, Springer Heidelberg. doi: 10.1007/s40565-018-0455-8.
[6] T. Kerdchuen and Ongsakul Weerakorn, “Optimal Placement of PMU and RTU by Hybrid Genetic Algorithm and Simulated Annealing for Multiarea Power System State Estimation,” 2009.
[7] R. Saha, “Demystifying Micro Synchro Phasor for the Evolving Grid,” 2024.
